It is always interesting to look at data as it often validate assumptions or provide insight into things you might not expect. I took a look at data from the Indiana Department of Education site. The site provides numerous reports on schools across Indiana. In this article, I wanted to highlight a couple of data points about Hamilton Southeastern (HSE) Schools.
Recently, there has been a lot of talk and rallies around Black Lives Matter. That raised the question of how diverse is Hamilton Southeastern Schools. Is diversity changing at HSE?
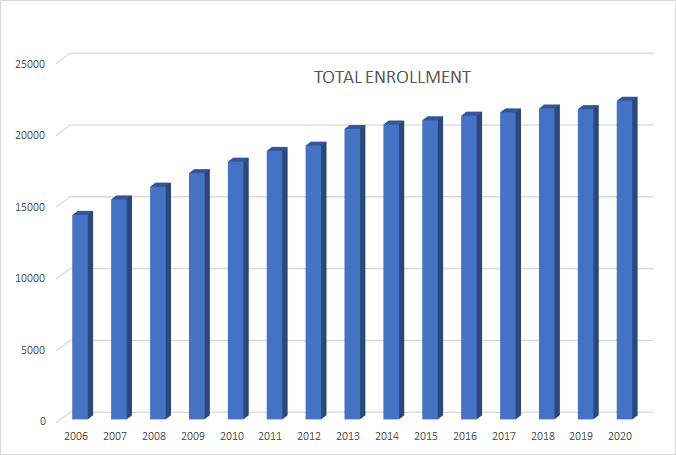
In looking at the data from 2006 to 2020, it is best to look at overall growth in the schools first. As can be see by the following chart, the crazy growth in the area seems to be over; however, growth is still happening. With such large numbers of students, even small growth can have a huge impact. Just 3% growth when you have roughly 22,000 students can equate to a new school building. Projected growth for this year according to the state data is around 584 students, which is above the average of just over 400 for the past 10 years and more than double the 200 student average for the past 5 years.

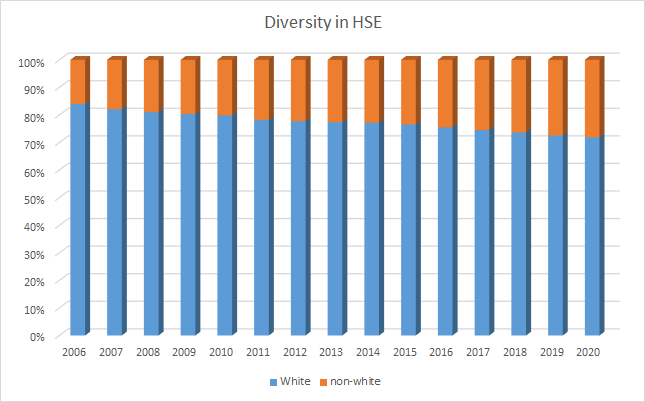
While numbers have been growing, so has the level of diversity. The following chart shows the ratio of white to non-white students within HSE from 2006 to 2020:

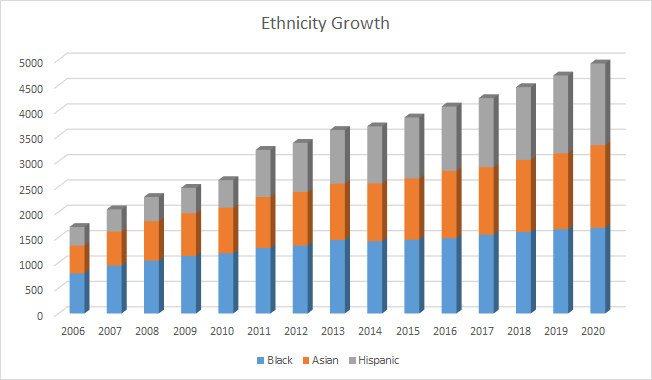
In case you are interested in the growth, it is across a number of areas as shown by the next image:

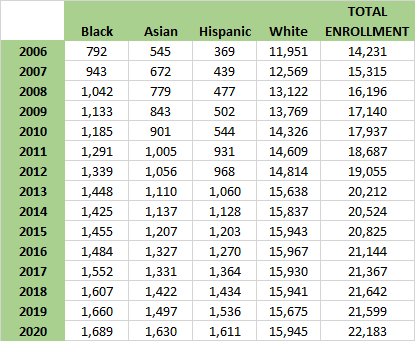
If you are interested in the numbers, the following image contains the data used to create the charts. This can also be found at the link provided at the top of this article.

Of course, this is a look at just the student data. While student diversity has reached over 28%, staffing has tended to be far behind. That, however, is data for another post…..
# # #
